Skip to content
A world of energy transition possibilities awaits.
Just fill out the form.

THE
OUTLOOK
FOR SAF

THE OUTLOOK FOR SAF
Four forces are shaping the landscape of SAF: supply from producers, demand from the market, industry incentives from governments, and technological processes. In this section, we will look at how it will change tomorrow – giving you a sense of where you stand as the world changes.

Based on data from industry sources, and government data, these graphs present a timeline for each main trend.

Show All Hide All

TIMELINE 1: THE SAF SUPPLY CURVE

SAF supply depends heavily on government incentives (USA) and government mandates (EU): see Section 6 for a policy overview covering both sides of the Atlantic. The principal limiting factors are the availability of feedstocks and the demand for fuel from non-aviation sectors. Combining several sources, this graph offers a consensus on expected SAF production through 2050. The USA is a major contributor, with government planning for 3bn gallons per year by 2030 and 35bn gallons by 2050.


Figur THE OUTLOOK FOR SAF 1

Global predicted SAF production, 2022-205022 (millions of tonnes)


Some analysts see the high Compound Annual Growth Rate (CAGR) of 17.3%23 required as unrealistic. However, this is largely due to today’s low base – which is ramping up with startling speed. While IATA24 states investments are already in place to exceed 5m tonnes by 2035 – with no accounting for investment yet to come.

TIMELINE 2: A SAF DEMAND CURVE

Demand for SAF is growing rapidly25; however, planned production suggests supply will largely answer this demand through 2027. But with analysts suggesting a CAGR of 26.2% between 2022 and 205026, the bulge in demand (green) over supply (blue) is most prominent beyond 203027.


Figur THE OUTLOOK FOR SAF 2

Global predicted SAF demand, 2022-2050 (millions of tonnes)28


SAF demand, however, is subject to many caveats. The increased price of travel and rationalizations in the industry may affect passenger numbers29; many feel growth is unlikely to return to historical levels of 4-5%, with Bain predicting 3%30, while BloombergNEF’s Economic Transition Scenarios show a varying gap depending on the scale and rate of policy change by 203031.

In addition, this chart assumes global demand for jet fuel includes the set percentage goals of SAF from previous charts – in other words, SAF demand here rises much more sharply than jet fuel demand as a whole. This suggests demand will outstrip supply by as much as 25% or more32 until 2040.

TIMELINE 3: THE COURSE OF LEGISLATION

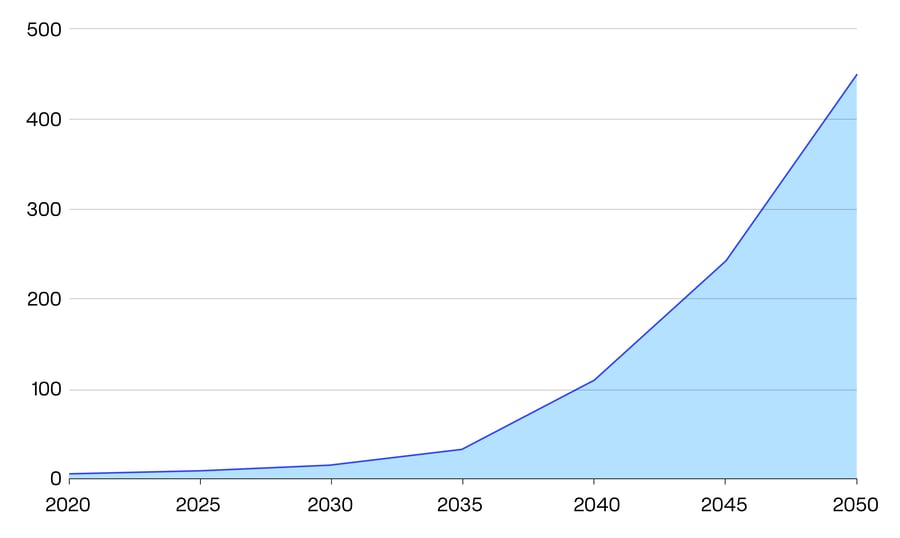
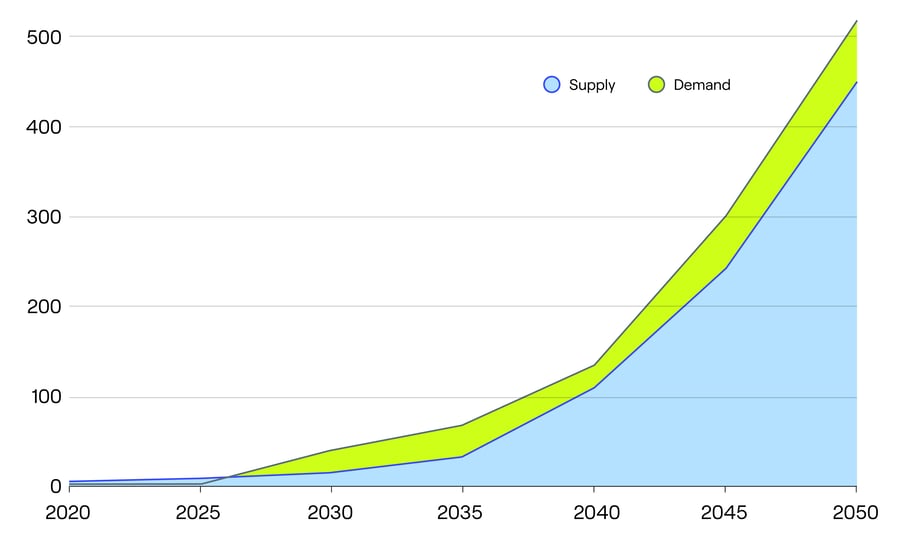
The EU and USA take different approaches to developing the SAF economy – although many experts expect these approaches to converge with time. Simply put, Europe’s ReFuelEU mandates steadily increasing blends of SAF for flights originating in the EU; the USA incentivizes with specific sums payable per gallon of low-carbon fuel produced. These two graphs show the expected course of mandates and incentives for the two regions, based on current understanding of legal roadmaps.


Figur THE OUTLOOK FOR SAF 3.1

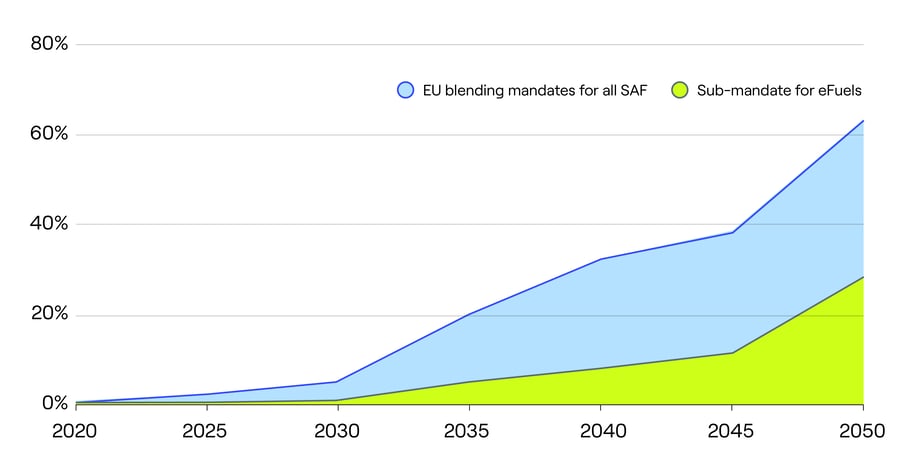
Chart: EU blending mandates for all SAF and sub-mandate for eFuels


Note that in July 2022, MEPs voted for more ambitious targets of 85% by 2050; this vote has not (yet) been ratified. In addition, other proposals require aircraft taking off from EU airports to take 90% of their fuel load from that airport – discouraging “fuel tankering”, or the practice of carrying more fuel than needed on route segments to reduce the need to refuel where costs are high33


Figur THE OUTLOOK FOR SAF 3.2

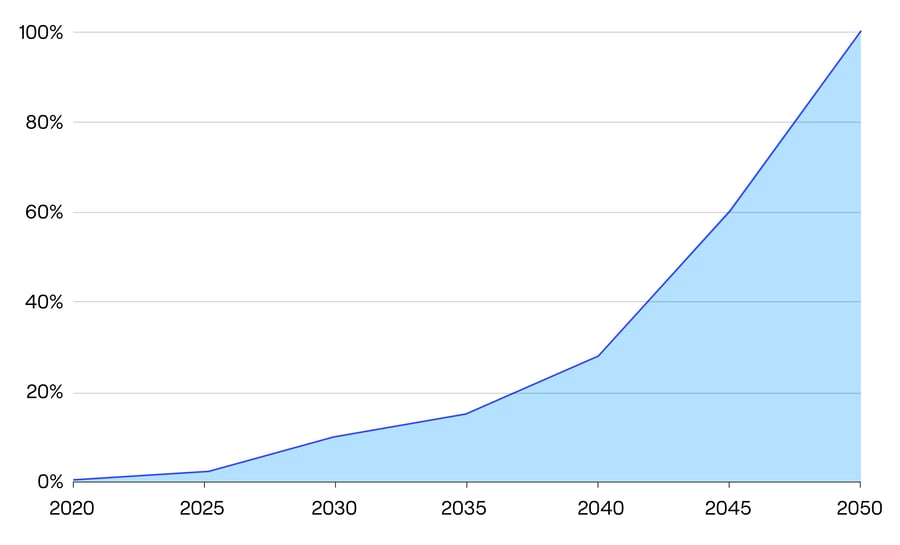
Chart: Incentivized USA targets for SAF use by US airlines (note % of use not % of blend)


The USA’s SAF Grand Challenge is a production target that aims to answer demand, rather than a mandated usage target. Through 2025 USA legislation allows for a USD 1.25-1.75 subsidy per gallon of SAF, with a plan to achieve a 50% decrease in lifecycle GHGs. This supports a goal of producing 3bn gallons of SAF per year by 2030 on the way to ensuring SAF supplies for 100% of aviation fuel demand by 205034

TIMELINE 4: EVOLVING TECHNOLOGIES

SAF isn’t one technology but several, with differing pathways and processes. Seven distinct approaches can transform oils, alcohols, biomass, waste, and even atmospheric CO2 into jet fuel, grouped into: biofuels, recycled carbon fuels, and eFuels. The former uses hydroprocessing and gasification on carbon-rich feedstock; the latter may use electrolysis and carbon capture to blend hydrogen and carbon dioxide, with energy from renewable sources. Emissions savings range from 73% to 100%, putting true Net Zero on the horizon.

It’s expected that the dominant technologies supplying SAF to the market will change with time – with targets and goals already proposed. The 290 member airlines of IATA aim for an ambitious zero net emissions by 2050; this graph shows the organization’s ideal outcome, spanning a variety of production pathways and products. Note that  several technologies are still in their early stages and therefore speculative.


Figur THE OUTLOOK FOR SAF 4

Chart: IATA's Climate Ambition Pathway. Aviation fuel energy (in TWh) from each technology as % of total consumption, 2020-2050.


This chart uses TWh on the y-axis since it includes non-volumetric and differing-volume fuels like hydrogen and electric. Fossil fuel continues to dominate energy consumption until after 2030, with HEFA and PtL drawing level around 2035 as fossil use drops off to reach zero after 2045. Power-to-liquid technologies become the majority around 2040, but themselves start to fade around 2050 when currently considered exotic technology may become viable.