

Knowledge & insights
Knowledge & insights
Featured topics
By type
-
Featured
.png) Topsoe Academy™ Topsoe Academy™ is your chance to tap into over 80 years of accumulated knowledge Find out more
Topsoe Academy™ Topsoe Academy™ is your chance to tap into over 80 years of accumulated knowledge Find out more -
 Discover how we meet the new energy reality to drive a sustainable future. Read
Careers
Careers
-
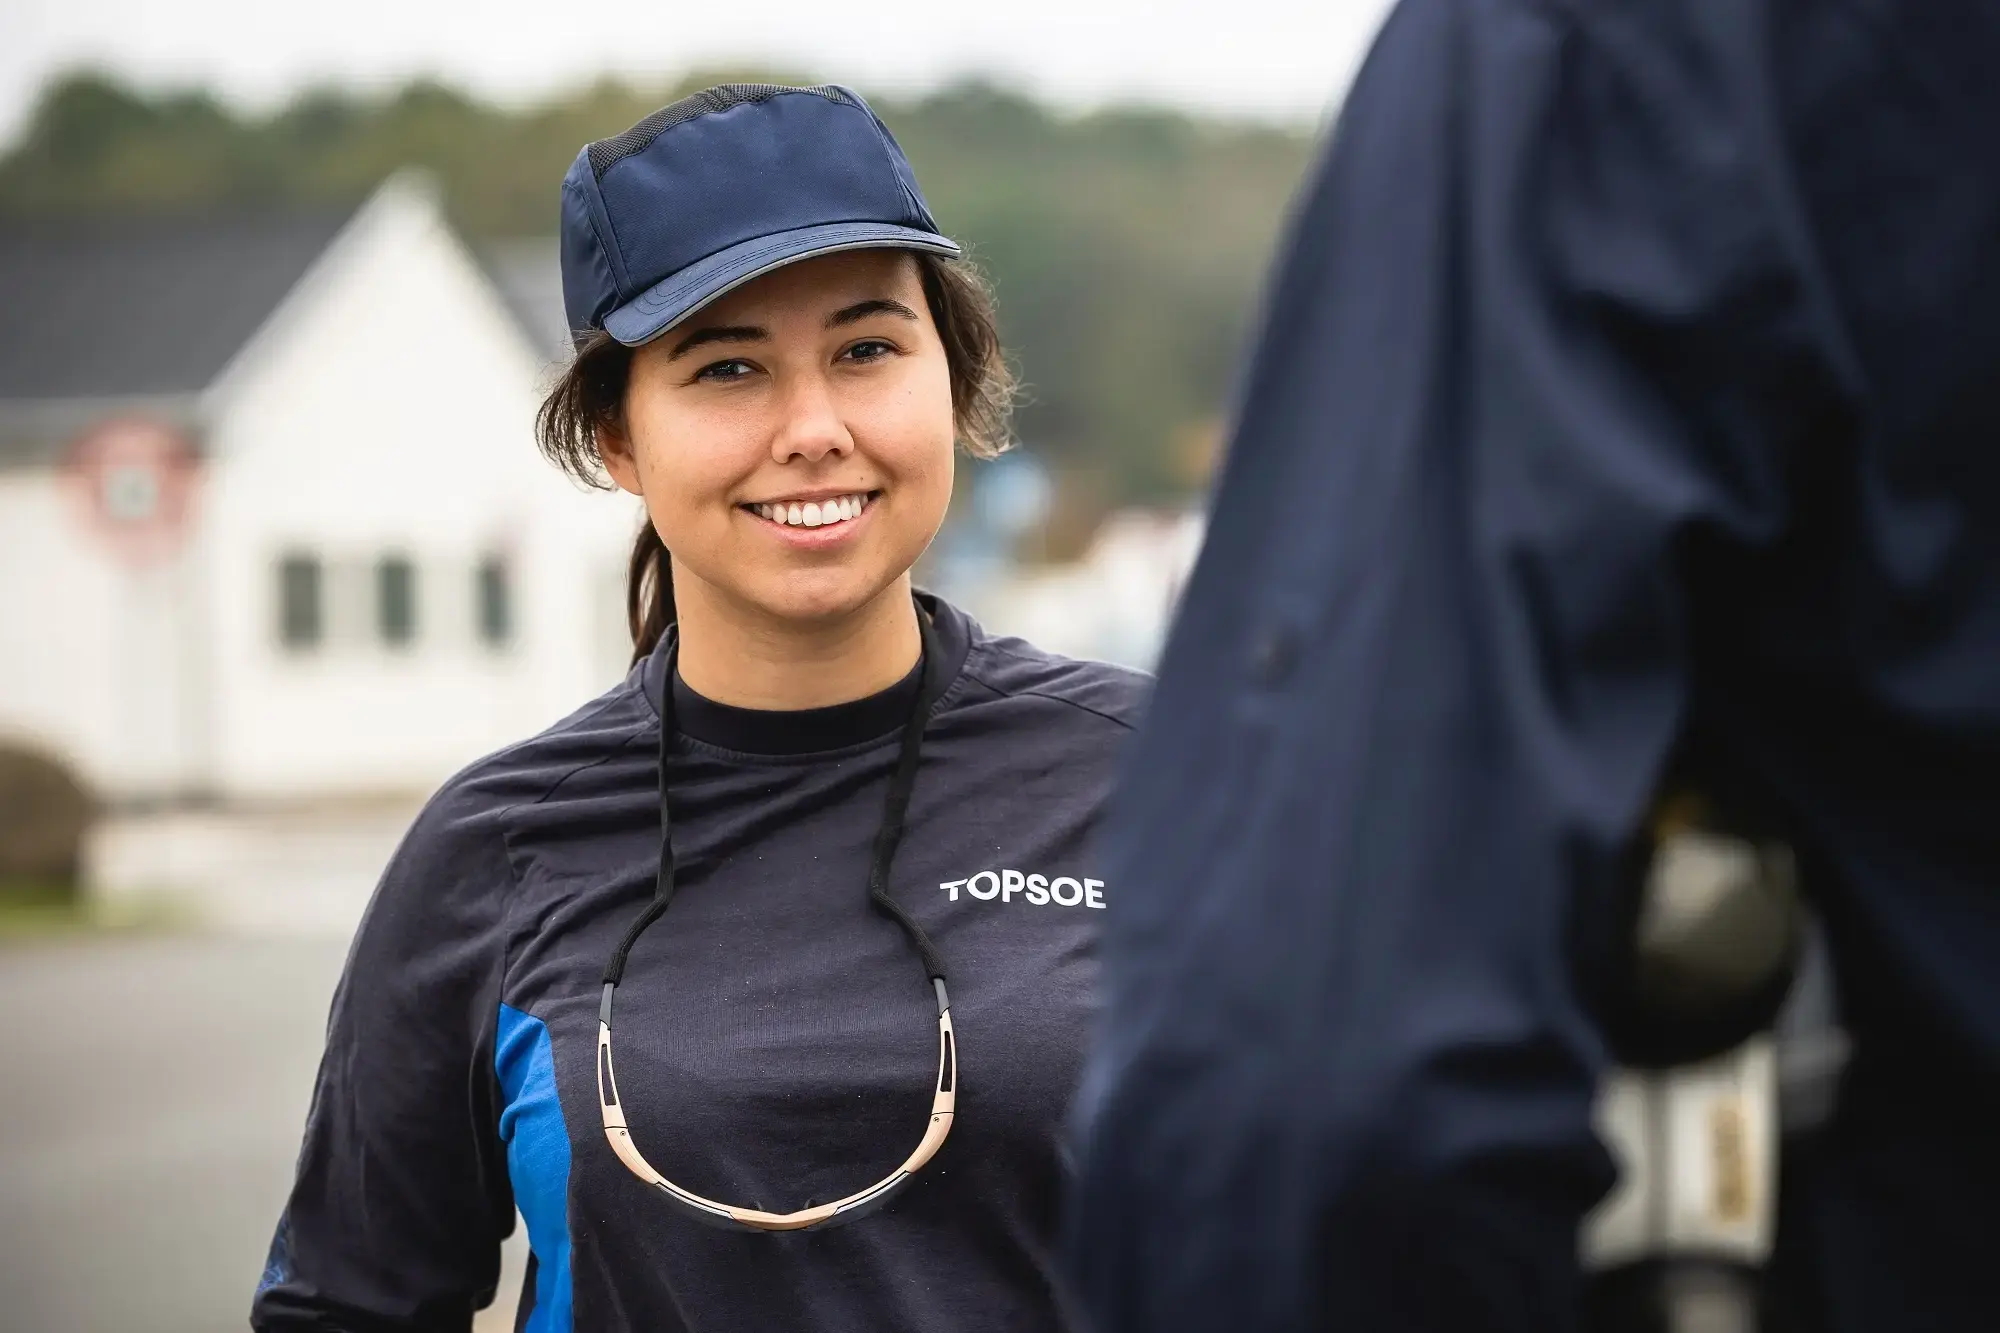
 If you’re ready to work alongside inspiring people like Hadise, Go solve at Topsoe.A place to make an impactRead